
A few years ago I build a canoe for my parents. I had been living with a grad school buddy of mine for a few years and had always been aware of a book on the shelf in the living room titled “The Strip Built Kayak”. He had built a cedar strip kayak a few years before and after some convincing, persuaded him to help me build my first project, though we decided to build a canoe “Strip Built Canoe” instead due to the simpler construction. Over several months, much frustration, but overall a lot of fun, we succeeded in building my boat which I gave to my parents for Christmas that year. Side note- don’t use epoxy in the winter in Wisconsin.
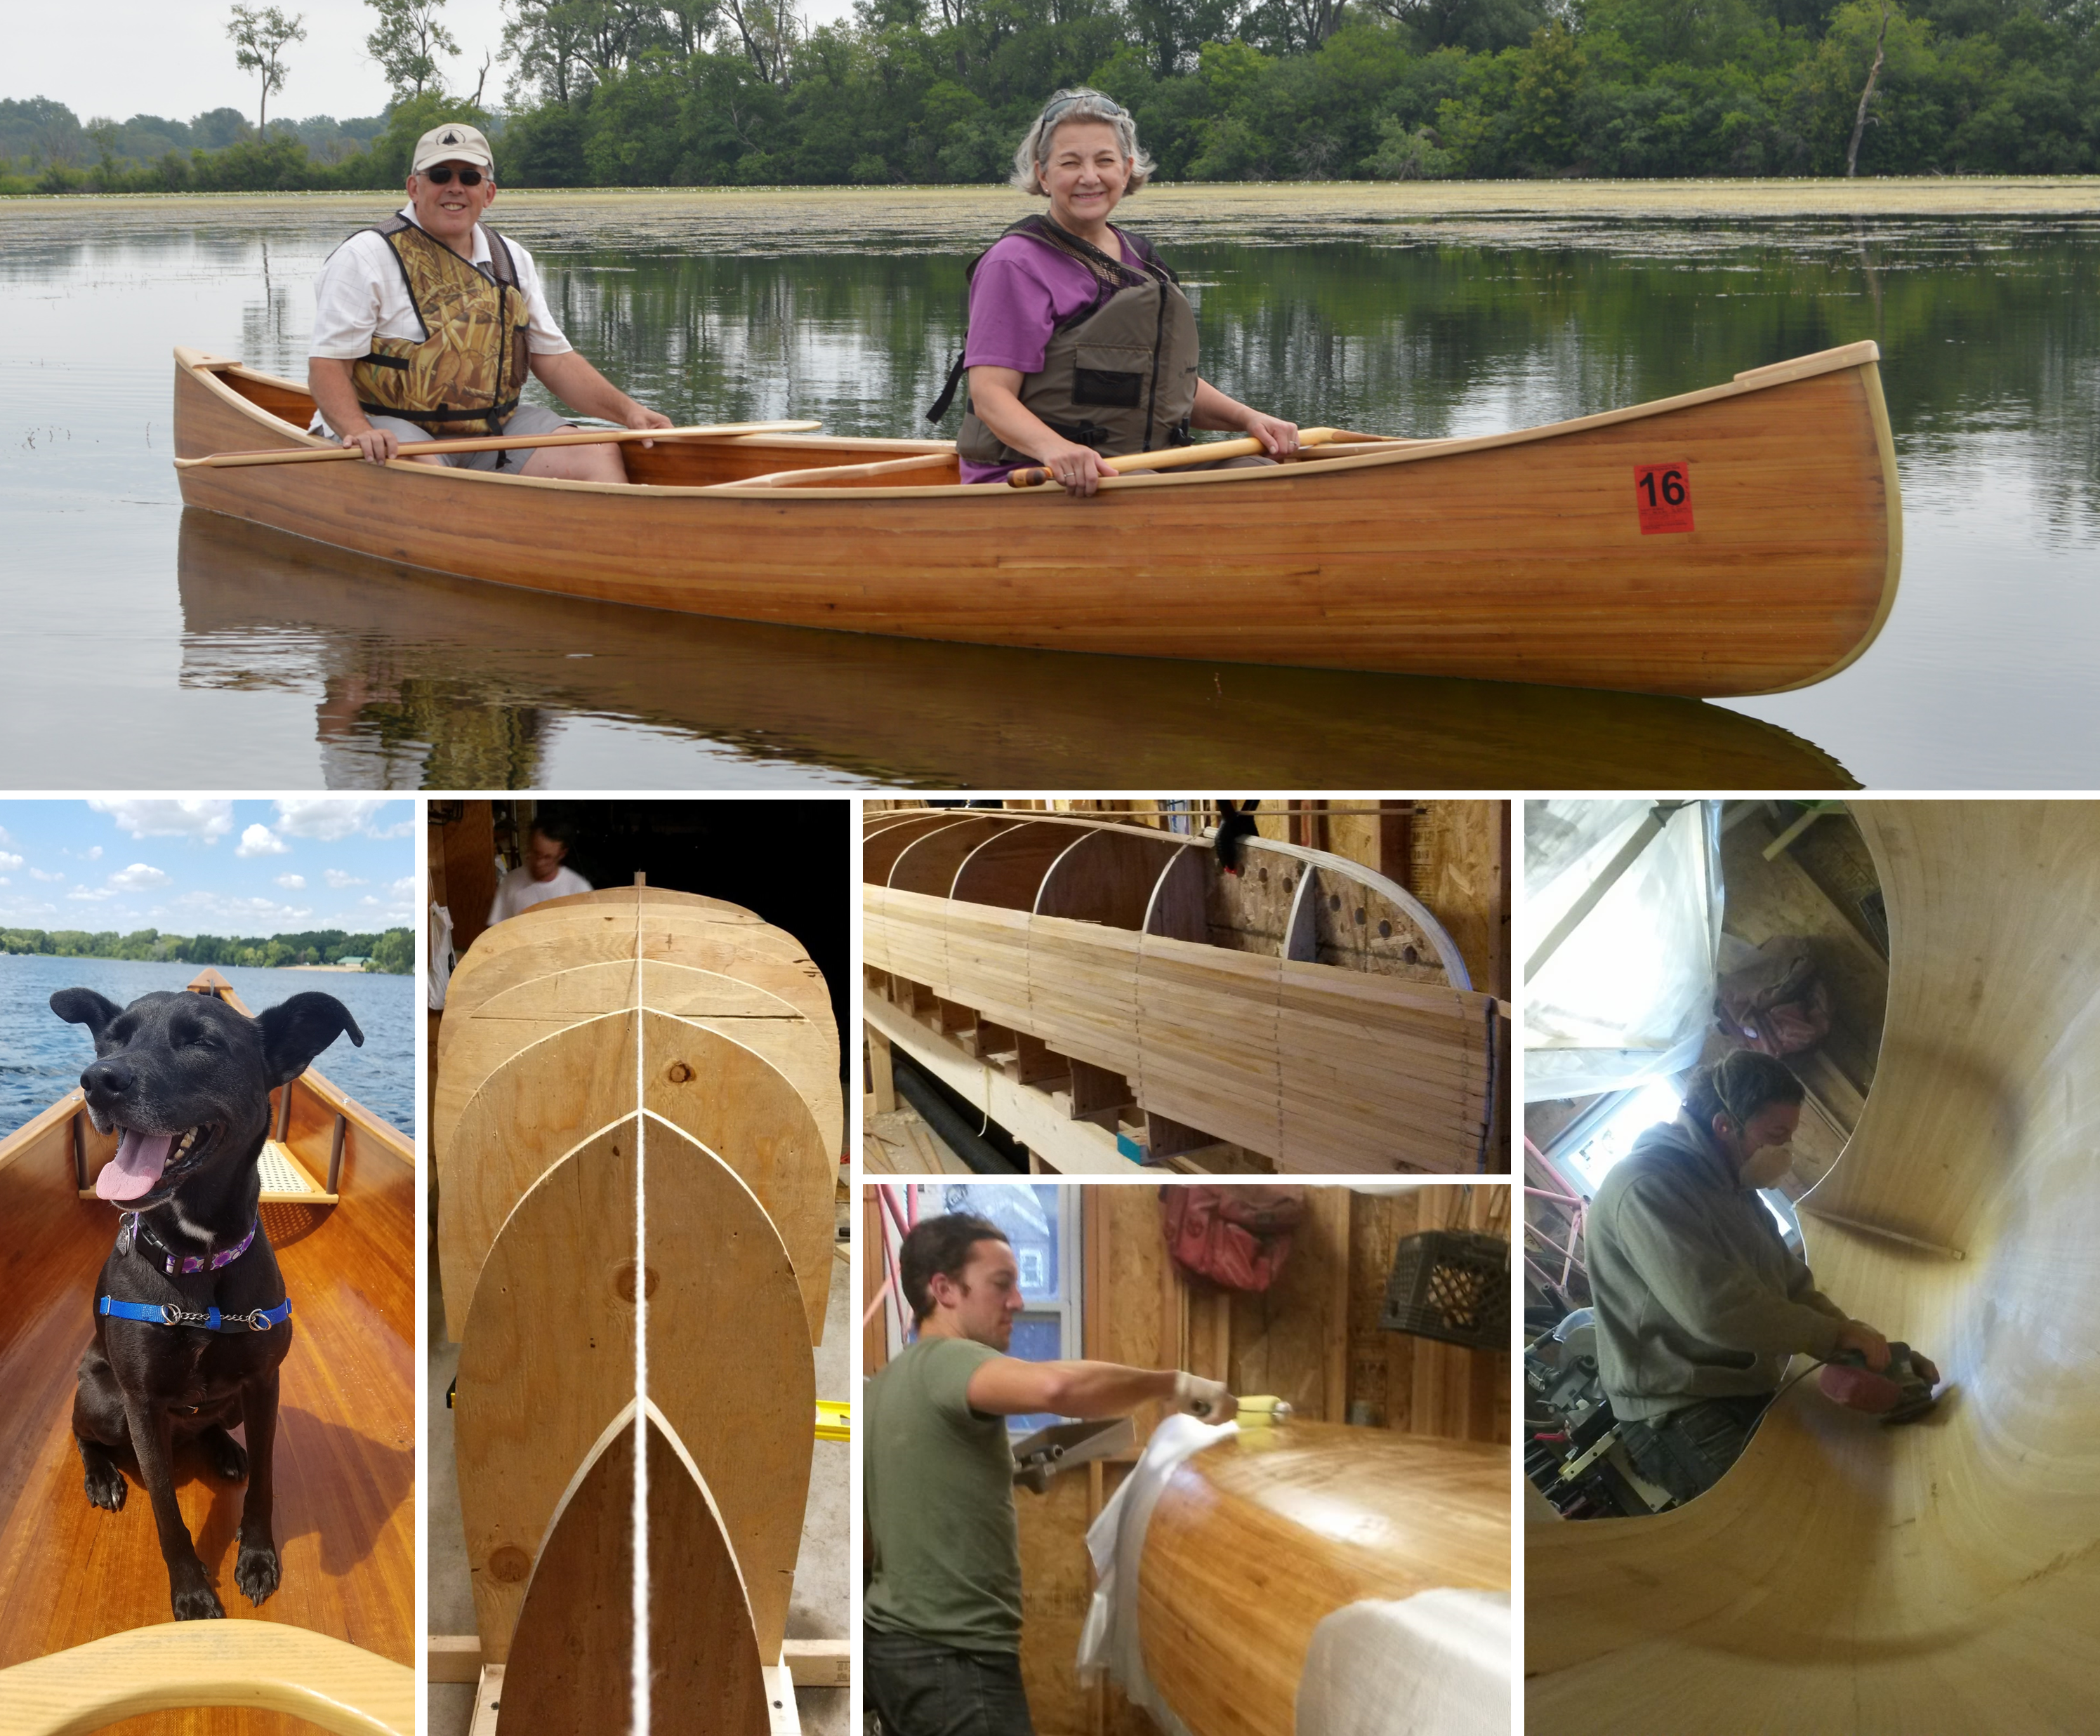
The making of the canoe
As my first project I was very happy with it, but since then I’ve always been thinking about how to make it better and what I would do with the next boat. So a couple weeks ago while we were in the Boundary Waters (on Steph and Norah’s first trip!) I had the idea that led to this post. Lots of people put designs in the sides of their canoes using different colored cedar strips and I had always wanted to find the right idea to put on mine. So the idea that hit me: Pi… in binary. So as of this writing we’re still a ways off from me being able to build a boat (I’m waiting for some designated garage space where I can build as slowly or quickly as I please), but after coming back from the BWCAW, I had some fun in Python to quell my curiosity. After all, what does pi look like in binary?
First an aside on binary. For those unfamiliar, binary is the representation of numbers in their base-2 form. The word binary refers to the fact that there are only two available numbers (bi (two) nary (numbers)). We typically represent numbers in base-10, using the digits 0-9 to represent quantities, where each digit is a power of the base. Take the number 83: From right to left the digits ‘3’ and ‘8’ are in the ‘Ones’ and ‘Tens’ column. In this case signifying that we have eight 10s and three 1s. Similarly in base-2 instead of the digits representing different powers of 10, they represent different powers of 2, so from right to left the digits would represent the ‘Ones’, ‘Twos’, ‘Fours’, ‘Eights’, and so on. Thus if we wanted to write 83 in binary we would write 1010011- one 1, one 2, one 16, and one 64. Just as we use the digits 0-9 for base-10, we only use 0s and 1s in base 2. This is what makes it so useful in computer programming, where essentially a series of switches in the “on” or “off” position can be used to represent a number. Incidentally, this makes it useful for this project as well, since I only want to use two types of wood in my design.
To encode pi into the side of my boat I plan on representing each digit individually from left to right as we would normally see it, with each digit’s binary representation being stacked vertically. Since it takes four bits to represent the digits from 0-9 (9=1001 in binary), this design will take up four layers of cedar near the gunnel of the canoe.
It’s a simple enough program. It essentially creates four arrays, one for each of the powers of 2 (ones, twos, fours, and eights), where each array is the bit representation of that power of 2 for each digit (So for example, the ones array contains the ‘ones’ bit information for each digit of pi). It turns out that the standard libraries (scipy, math, numpy) only have around 50 digits of pi, so I used mpmath which allows me to let the user set how many digits of pi they want to see. I’ll put the code below for people to look through if they’re interested to see how I made these plots, but here is the result.
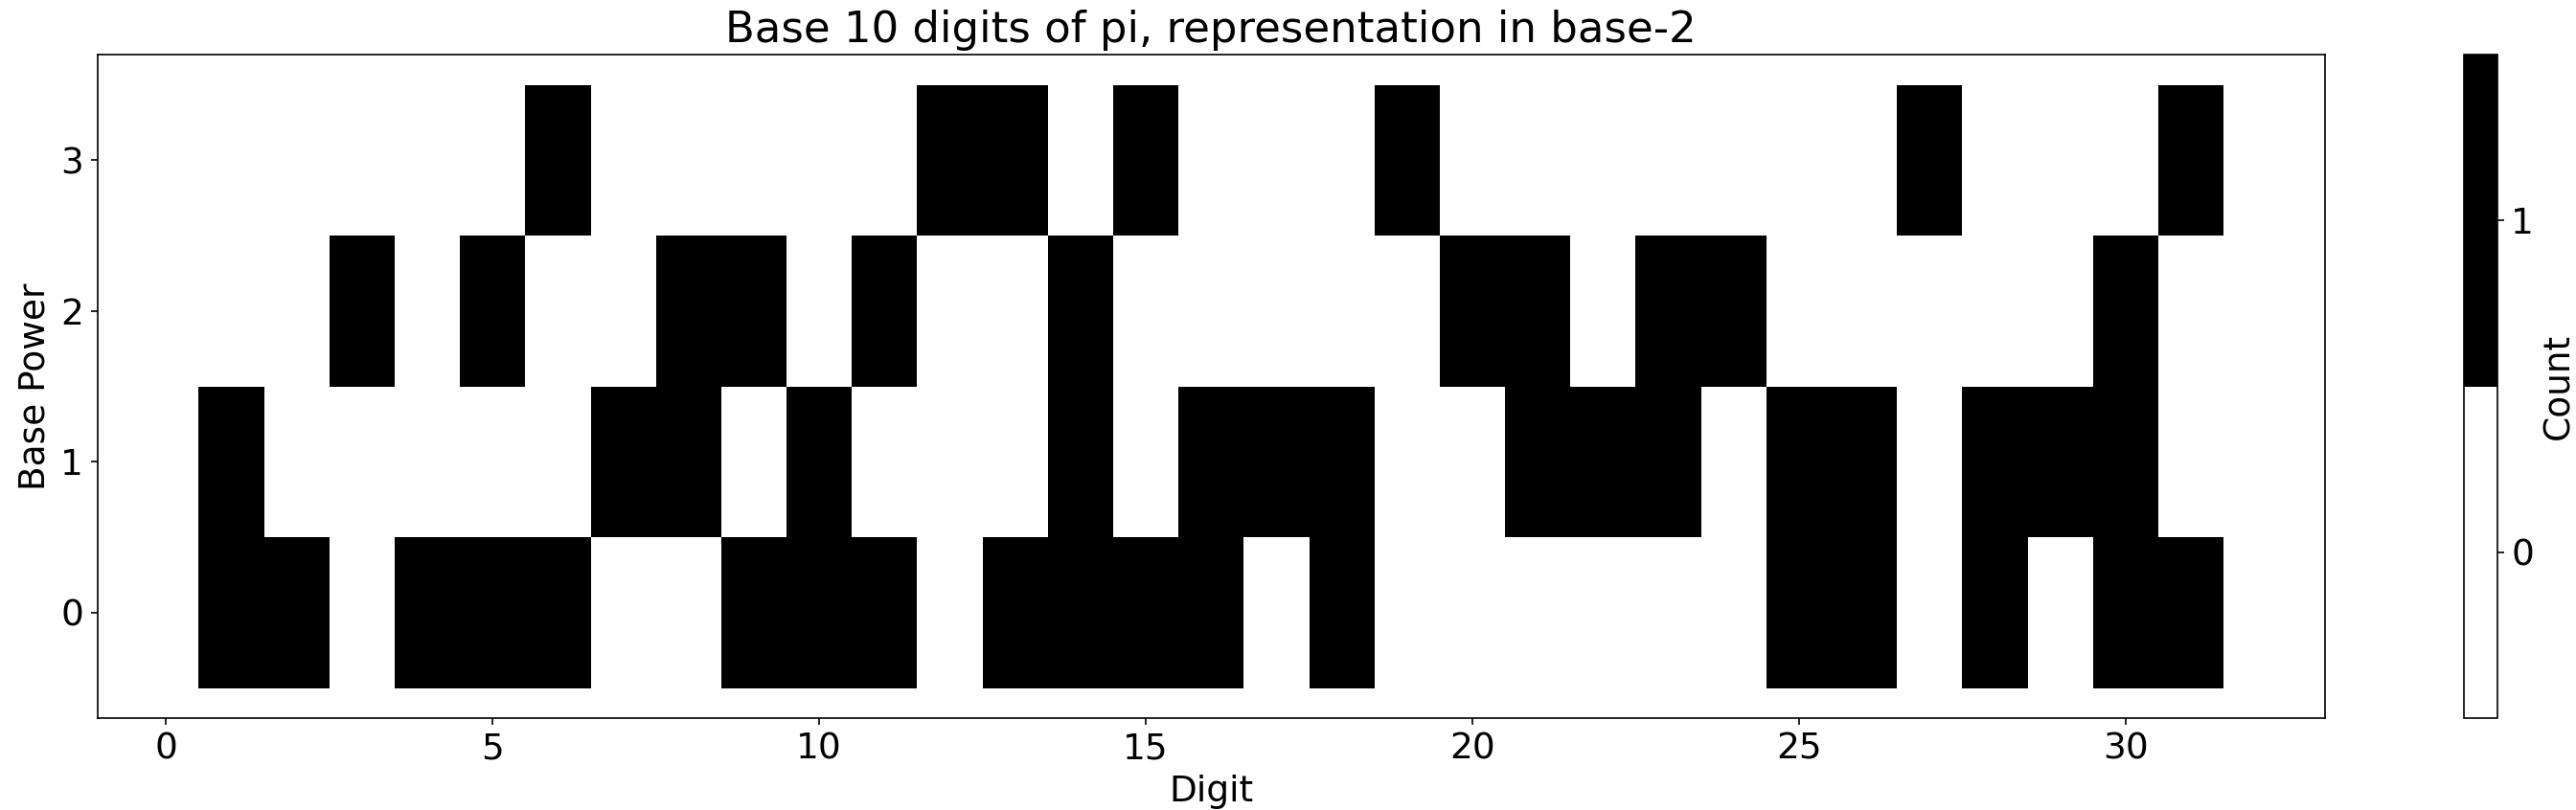 Binary visualization of (base 10) pi
Here the power of 2 are stacked vertically so that the ‘ones’ are on the bottom, ‘eights’ are at the top. So in the left-most column we see that the ‘ones’ and ‘twos’ column is black, indicating the bit 0011 = 3. The second and third are 0001 = 1 and 0100 = 4 respectively. 314…
The Code
import numpy as np
from mpmath import mp
import matplotlib.pyplot as plt
import matplotlib as mpl
import matplotlib.colorbar as cbar

# Representation of the BASE 10 DIGITS of a number in a different base
def digify(num_digits, number='pi', base: int = 2):
    num_str = ''
    fig = plt.figure(f'Base 10 digits of {number}, representation in base-{base}', figsize=(25, 6))
    plt.rcParams.update({'font.size': 18})
    ax = fig.add_subplot(111)
    mp.dps = num_digits + 1
    if number == 'pi':
        num_str = str(mp.pi)
    max_power = int(np.floor(1 / np.log10(base)))
    num_str = ''.join(num_str.split('.'))  # remove period
    digits = [int(n) for n in num_str]
    for i, dig in enumerate(digits):
        dig_decr = int(dig)
        while dig_decr > 0:
            pwr = 0
            while base ** (pwr + 1) <= dig_decr:
                pwr += 1
            count = int(np.floor(dig_decr / base ** pwr))
            col = 1 - count / (base - 1)
            ax.fill_between([i + .5, i + 1.5], [pwr - .5, pwr - .5], [pwr + .5, pwr + .5], facecolor=str(col))
            dig_decr -= count * base ** pwr

    cax, _ = cbar.make_axes(ax)
    cb = cbar.ColorbarBase(cax, cmap=mpl.colors.ListedColormap([str(s) for s in np.linspace(1, 0, num=base)]),
                           norm=mpl.colors.Normalize(vmin=-.5, vmax=base - .5), ticks=np.arange(base))
    cb.set_label('Count')
    ax.set_xlabel('Digit')
    ax.set_ylabel('Base Power')
    ax.set_title(f'Base 10 digits of {number}, representation in base-{base}')
    ax.set_yticks(np.arange(0, max_power + 1, 1))
But this solution isn’t ideal. It has always kind of bothered me that it requires four bits to represent a base-10 number in base-2. This would mean I need four rows of little cedar pieces, and I can’t imagine that’d be very easy to put together. So as a first step I increased the base. The trade-off of course is that as the base number increases, you need more colors. In base-3 for example, I’d need 3 shades to represent each digit 0, 1, and 2, but we only need three trinary digits to represent a base 10 number.
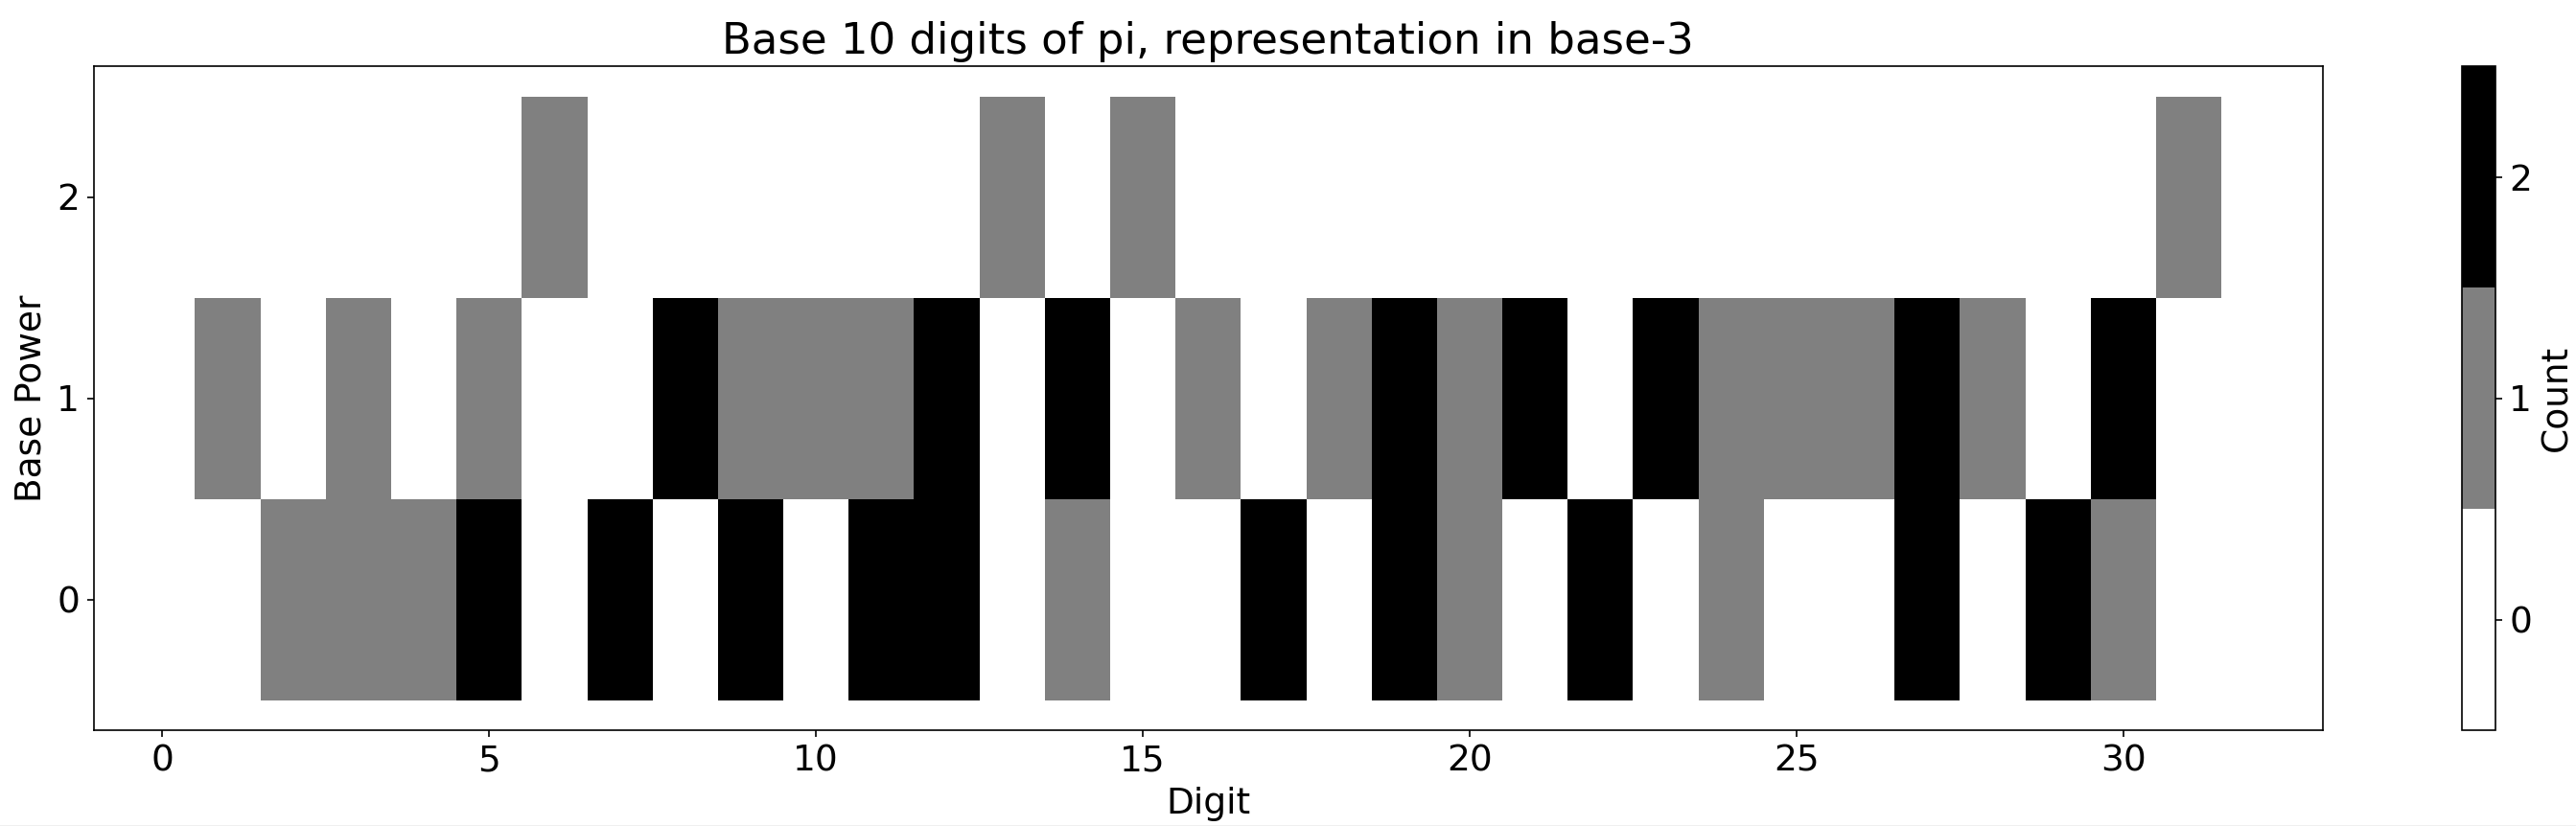 Trinary visualization of (base 10) pi
We can represent a base 10 number in base 4 with only 2 digits (and 4 shades)
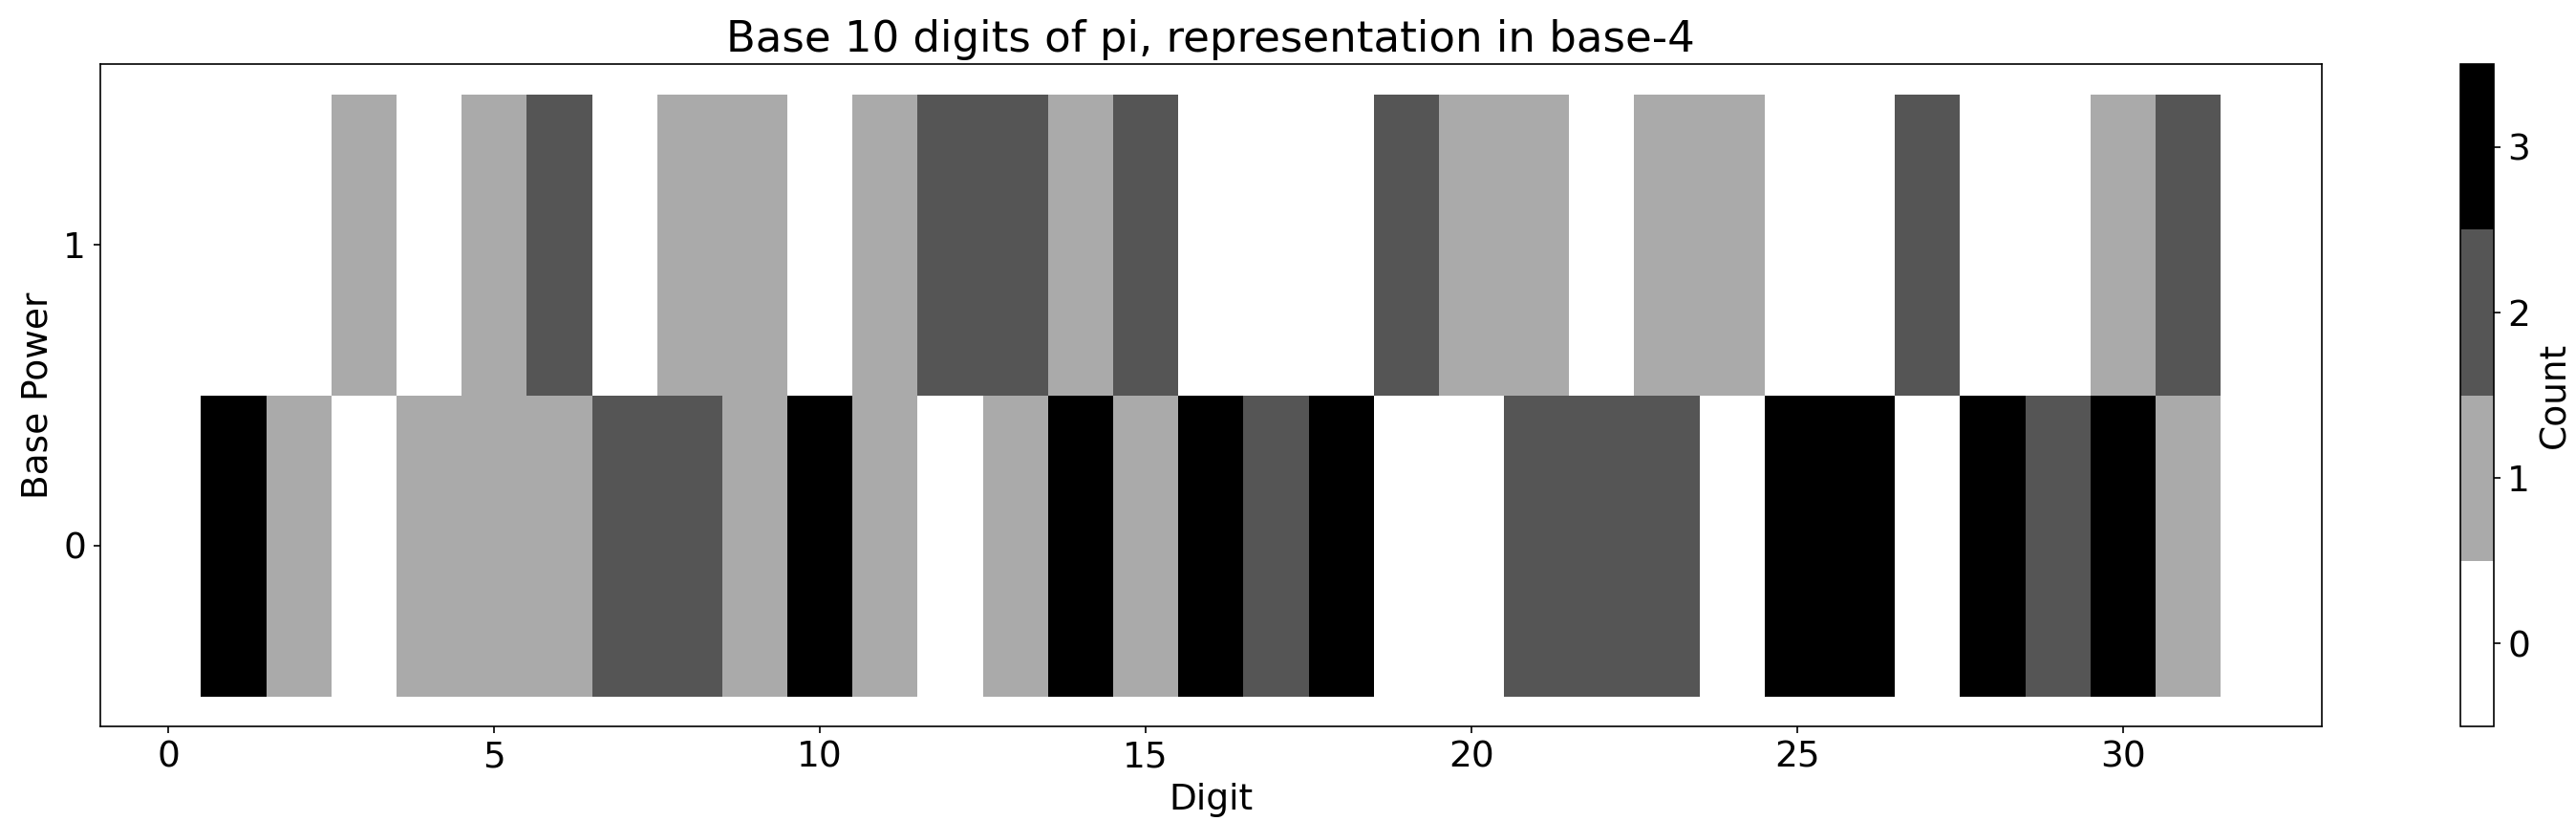 Quaternary visualization of (base 10) pi
Now the trouble with all of this, is that so far we’re just representing base 10 digits in different bases. But there’s nothing special about base 10, so the question really is… how do we represent pi in another base? Let’s consider base 2 again. We know 3 (in base 10) is 11 (in base 2), but how do we represent decimal places? Just like in base 10, where the first spot to the right is “tenths” then “hundreths” and so on, which is to say 10^-1, 10^-2… to the right of the decimal in base 2 is 2^-1, 2^-2, etc. A final reworking of the code and we can represent any number in any base:
import numpy as np
from mpmath import mp
import matplotlib.pyplot as plt
import matplotlib as mpl
import matplotlib.colorbar as cbar

def digify2(num_digits, which_num='pi', base: int = 2):
    fig = plt.figure(f'{which_num} representation in base-{base}', figsize=(25, 6))
    plt.rcParams.update({'font.size': 18})
    ax = fig.add_subplot(111)
    mp.dps = num_digits + 1
    if which_num == 'pi':
        number = mp.pi

    pwr_strt = 0
    while base ** pwr_strt <= number:  # brings pwr s.t. base**pwr > number
        pwr_strt += 1
    while base ** pwr_strt > number:  # get first pwr s.t. base**pwr <= number
        pwr_strt -= 1
    num_str = ''
    pwr = int(pwr_strt)
    while pwr > pwr_strt - num_digits:
        count = int(np.floor(number / base ** pwr))
        col = 1 - count / (base - 1)
        ax.fill_between([pwr - .5, pwr + .5], [0, 0], [1, 1], facecolor=str(col))
        number -= count * base ** pwr
        num_str += str(count)
        if pwr == 0:
            num_str += '.'
        pwr -= 1

    cax, _ = cbar.make_axes(ax)
    cb = cbar.ColorbarBase(cax, cmap=mpl.colors.ListedColormap([str(s) for s in np.linspace(1, 0, num=base)]),
                           norm=mpl.colors.Normalize(vmin=-.5, vmax=base - .5), ticks=np.arange(base))
    cb.set_label('Count')
    ax.set_xlabel('Base Power')
    ax.set_xlim(ax.get_xlim()[::-1])
    ax.set_yticks([])
    ax.set_title(f'{which_num} representation in base: {base}\n{num_str}')
It was a fun exercise, and now we can represent pi as a single row of two colors, perfect for a kayak. And what’s more, I can cut longer pieces of cedar, if we have five 0s in a row I can cut a piece 5x longer. So here’s 50 digits of pi in binary!
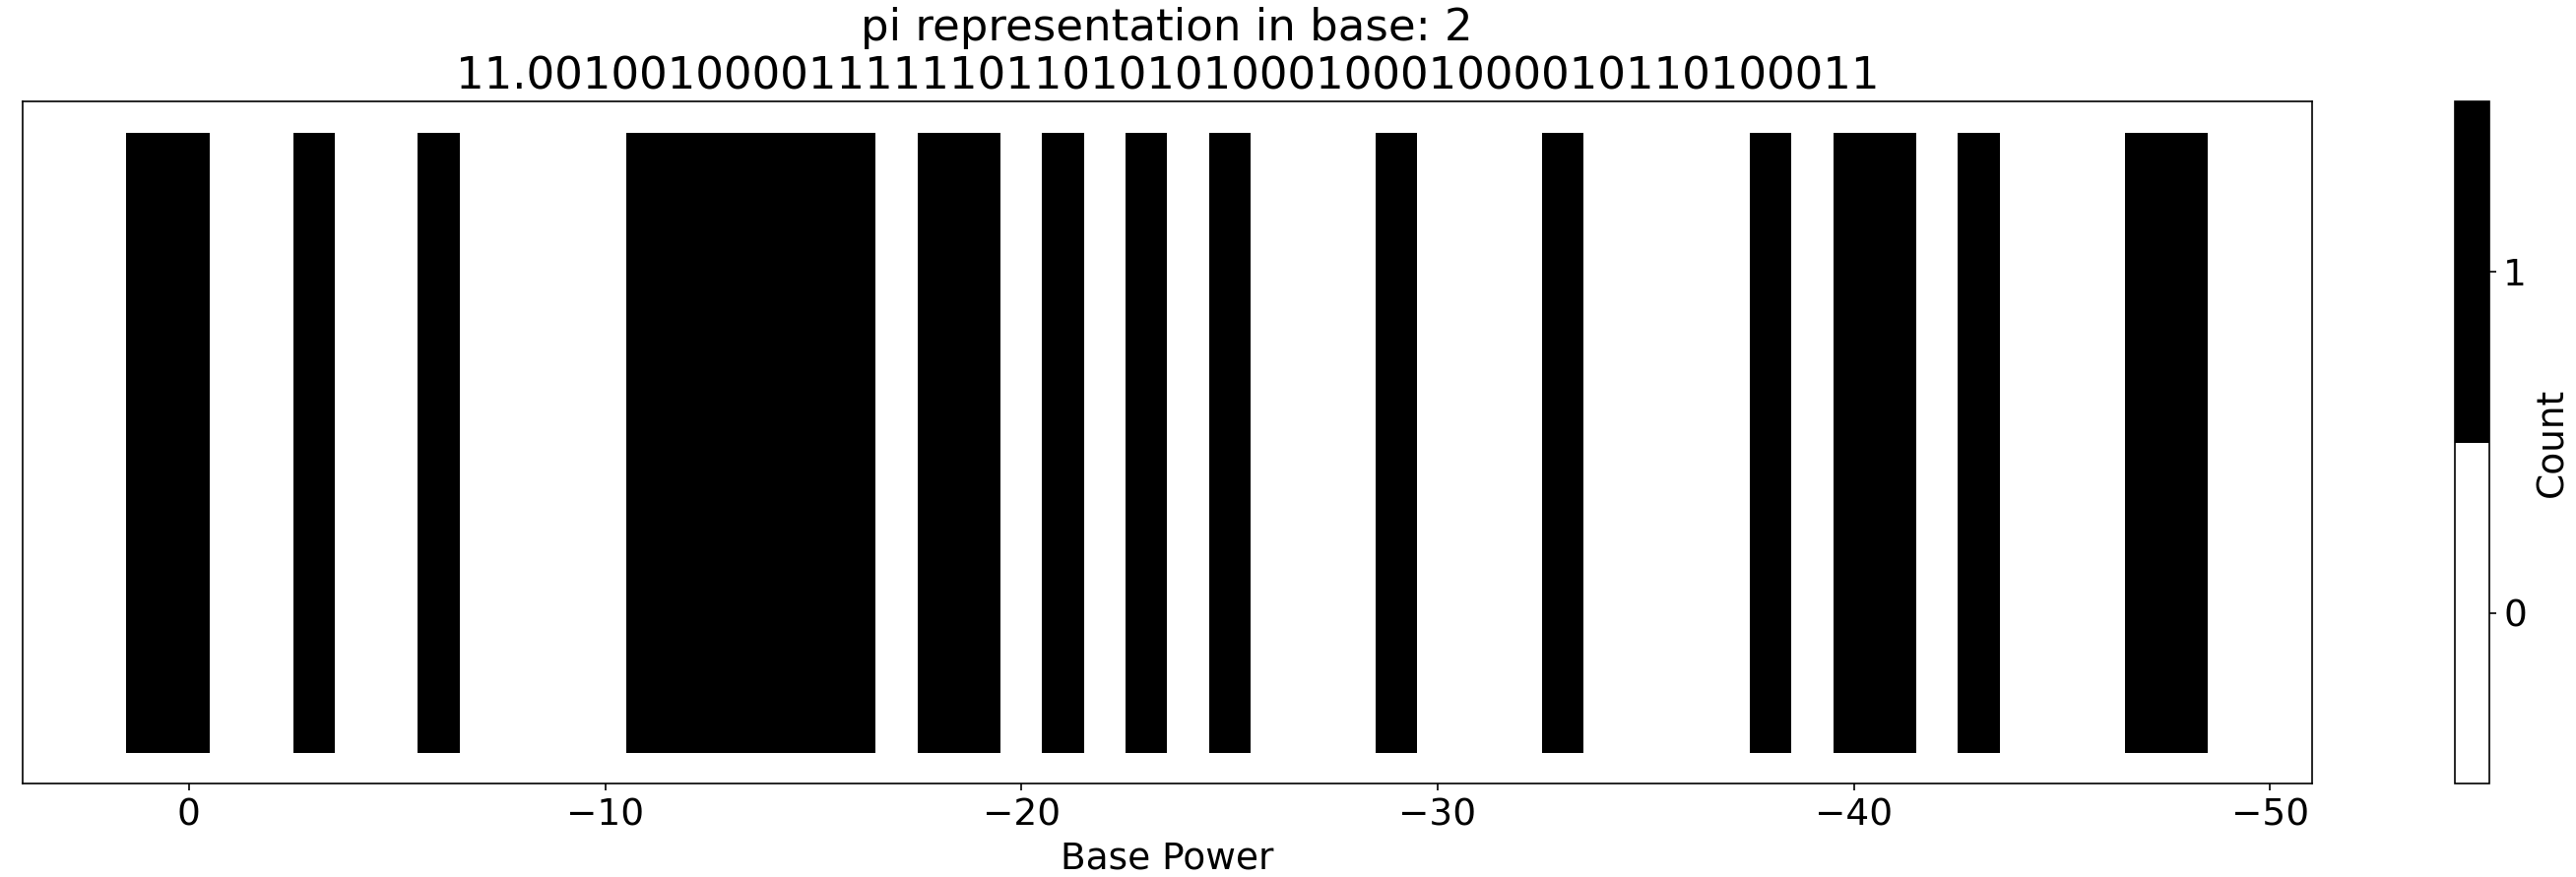 Binary visualization of pi